Bollinger Bands Modified (Stormer)This strategy is based and shown by trader and investor Alexandre Wolwacz "Stormer".
Overview
The strategy uses two indicators Bollinger Bands and EMA (optional for EMA).
Calculates Bollinger Bands, EMA, highest high, and lowest low values based on the input parameters, evaluating the conditions to determine potential long and short entry signals.
The conditions include checks for crossovers and crossunders of the price with the upper and lower Bollinger Bands, as well as the position of the price relative to the EMA.
The script also incorporates the option to add an inside bar pattern check for additional information.
Entry Position
Long Position:
Price cross over the superior band of bollinger bands.
The EMA is used to add support for trend analysis, it is an optional input, when used, it checks if price is above EMA.
Short Position:
Price cross under the inferior band of bollinger bands.
The EMA is used to add support for trend analysis, it is an optional input, when used, it checks if price is under EMA.
Risk Management
Stop Loss:
The stop loss is calculated based on the input highest high (for short position) and lowest low (for long position).
It gets the length based on the input from the last candles to set which is the highest high and which is the lowest low.
Take Profit:
According to the author, the profit target should be at least 1:1.6 the risk, so to have the strategy mathematically positive.
The profit target is configured input, can be increased or decreased.
It calculates the take profit based on the price of the stop loss with the profit target input.
Cerca negli script per "inside bar"

Evolution Fractals with IBA standard fractal high has two lower high (or equal high) candles to its left and right.
For standard fractal low fractals this is vice versa.
-But this indicator plots has the option to plot standard fractals only after candle close is confirmed.
So if the current candle is still forming in live markets, only after this candle has fully closed, then the indicator checks if the fractal is valid and then plotted.
You can select this option On or Off
(with the standard fractal indicator there is a fractal plotted, but when this candle high (or low ) is broken again, the fractal disappears. This re-painting of fractals can cause confusion.
-Added an alert functionality.
When setting an alert on your chart, you can select this indicator to alert you upon the forming of a new fractal high or low.
-Added optional Inside Bar function.
When a candle High/Low does not breach the previous candle High/Low, then a different body color can be shown.
This is particular handy to quickly if this high/low is breached, without having to zoom in on the chart.

[Pt] TICK + Heikin Ashi RSI IndicatorThis indicator combines NYSE TICK and RSI to aim to provide a view of NYSE market trend strength.
What is TICK
NYSE TICK, also known as the TICK index, is a technical analysis indicator that shows the number of stocks on the New York Stock Exchange (NYSE) that are trading on an uptick or a downtick in a particular period of time. The TICK index is calculated by subtracting the number of stocks trading on a downtick from the number of stocks trading on an uptick. A reading of +1000 on the TICK index, for example, would indicate that there are 1000 more stocks trading on an uptick than on a downtick. The TICK index is often used as a measure of market sentiment, as it can provide insight into whether there is more buying or selling pressure in the market at a given time. A high TICK index reading may suggest that there is strong buying pressure, while a low TICK index reading may indicate that there is more selling pressure in the market.
By default, I am using -800 and 800 for oversold and overbought levels. These are configurable. Also, this indicator includes TICK divergence signals.
The TICK index is usually very volatile, so this indicator is best suited for lower timeframes, such as 1 to 5 min charts.
Idea of TICK neutral zone
As part of this indicator I've identified what I consider as "neutral" range for the TICK. Based on my own personal experience, the market tends to be in consolidation or choppy in this range. By default, I've defined this range to be -200 to 200. This range is configurable.
Signals
In combination with RSI and Heikin Ashi RSI (HARSI), which help smooths out the RSI values and make it easier to identify trends and potential reversal points, this indicator aims to generate Bullish vs Bearish signals based on the following conditions:
- bullish / bearish HARSI candle
- Inside bar on HARSI candle
- TICK trend (above or below Neutral zone)
- RSI trend (above or below 0, but not overbought or oversold)
- RSI / HARSI convergence and divergence
When all bullish conditions are met, the signal turns bright green. Bright red when all bearish conditions are met. These generated signals aims to provide users easy to read visual cues to help with their trades.
A table is also provided in attempt to identify the trend in real time:
TICK trend:
- Bullish, Extended
- Bullish
- Neutral w/ Bullish bias
- Neutral w/ Bearish bias
- Bearish
- Bearish, Extended
RSI:
- Bullish
- Bearish
Note on scale
This indicator is based on the scale for TICK, hence the RSI and HARSI are scaled. By default, standard overbought RSI value of 70 = 800 on this scale, whereas oversold value of 30 = -800.
Credits:
Heikin Ashi RSI code was borrowed from @JayRogers - Heikin Ashi RSI Oscillator


J2S Backtest: 123-Stormer StrategyThis backtest presents the 123-Stormer strategy created by trader Alexandre Wolwacz "Stormer". The strategy is advocates and shared by the trader through his YouTube channel without restrictions.
Note :
This is not an investment recommendation. The purpose of this study is only to share knowledge with the community on tradingview.
What is the purpose of the strategy?
The strategy is to buy the 123-Stormer pattern at the bottom of an uptrend and sell the 123-Stormer pattern at the top of a downtrend, aiming for a short stop for a long profit target.
To which timeframe of a chart is it applicable to?
Recommended for weekly and daily charts, as the signals are more reliable, being that strategy a good option for swing and position trading.
What about risk management and success rate?
The profit target is established by the author as being twice the risk assumed. Also according to the author, the strategy is mathematically positive, reaching around 65% of success rate in tradings.
How are the trends identified in this strategy?
Two averages are plotted to indicate the trend, a fast EMA average with an 8-week close and a slow EMA average with an 80-week close.
Uptrend happens whenever the fast EMA is above the slow EMA and prices are above the fast EMA. In this case, we should start looking for a LONG entry based on the signal of the 123-Stromer pattern to buying.
On the other hand, downtrend happens when the fast EMA is below the slow EMA and prices are below the fast EMA. In this case, we should start looking for a SHORT entry based on the signal of the 123-Stromer pattern to selling.
How to identify the 123-Stormer pattern for a LONG entry?
This pattern consists of three candles. The first candle has a higher low than the second candle's low, and the third candle has a higher low than the second candle's low. In this pattern, we will buy as soon as a trade occurs above the third candle's high, placing a stop as soon as a trade occurs below the second candle's low, with profit target twice the risk assumed. In another words, the amplitude of the prices of the three candles from the third candle’s high upwards. (you can use fibonacci extension to determine your stops and profit targets).
Importantly, the low of the three candles must be above the fast EMA average and in an uptrend.
How to identify the 123-Stormer pattern for a SHORT entry?
This pattern consists of three candles. The first candle has a lower high than the second candle's high, and the third candle has a lower high than the second candle's high. In this pattern, we will sell as soon as a trade occurs below the third candle's low, placing a stop as soon as a trade occurs above the second candle's high, with profit target twice the risk assumed. In other words, the amplitude of prices of the three candles from the third candle’s low down (you can use fibonacci extension to determine your stops and profit targets).
Importantly, the high of the three candles must be below the fast average and in a downtrend.
Tips and tricks
According to the author, the best signal for both LONG or SHORT entry is when the third candle is a inside bar of second candle.
Backtest features
Backtest parameters are fully customizable. The user chooses to validate only LONG or SHORT entries, or both. It is also possible to determine the specific time period for running the backtests, as well as setting a threshold in candels for entry by the 123-Stormer pattern.
Furthermore, for validation purposes, you can choose to activate the best signal of the pattern recommended by the author of the strategy, as well as change the values of the EMA averages or even deactivate them.
Final message
Feel free to provide me with any improvement suggestions for the backtest script. Bear in mind, feel free to use the ideas in my script in your studies.

Narrow Range (NR) IndicatorNarrow Range (NR) trading strategy is a breakout-based method that assumes that the price of security trends up or down after a brief consolidation in a narrow range. This indicator can plot:
1. Narrow Range (NR) 4, 7, and 21
2. Narrow Range (NR) 4, 7, and 21 + Inside Bars (IB)
NR 4/NR 7/NR 21 day acts as a confirming factor on where the price will move further. Breakout of NR 4/NR 7/NR 21 candle with high volumes indicates bullishness, while the breakdown candle indicates bearishness.

Common Candlestick PatternsCommon Candlestick Patters Highlighter.
- TLS: Three Line Strike (Bearish and Bullish)
- AB: Advance Block
- IB: Inside Bar

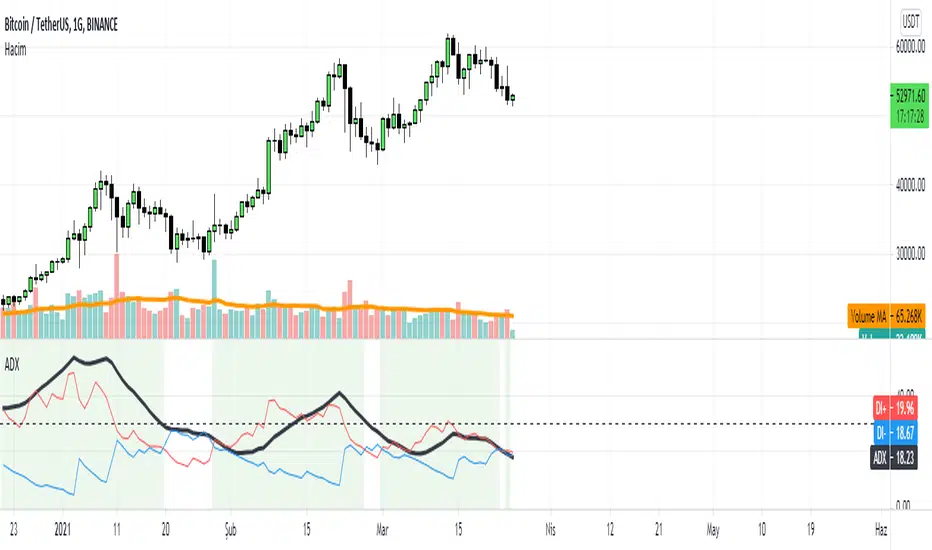
ADX with SignalsThis indicator basicly usind ADX ( Average Directional Index )
ADX can show us how trend is strong
ADX below 20: the market is currently not trending
ADX crosses above 20: signifies that a new trend is emerging. Traders may start placing sell or buy orders in the direction of the price movement.
ADX between 20 and 40: When the ADX is growing between 20 and 40 it is considered as a confirmation of an emerging trend. Traders should use this opportunity to buy or short sell in the trend's direction.
ADX above 40: the trend is very strong.
ADX crosses 50: the trend is extremely strong.
ADX crosses 70: a very rare occasion, which is called a “Power Trend.”
If we use ADX with DI+ and DI+ indactor can tell us to buy.
How can we calculate this all?
Directional Movement (DI) is defined as the largest part of the current period’s price range that lies outside the previous period’s price range. For each period calculate:
+DI = positive or plus DI = High - Previous High
-DI = negative or minus DI = Previous Low - Low
The smaller of the two values is reset to zero, i.e., if +DI > -DI , then -DI = 0. On an inside bar (a lower high and higher low), both +DI and -DI are negative values, so both get reset to zero as there was no directional movement for that period.
The True Range ( TR ) is calculated for each period, where:
TR = Max of ( High - Low ), ( High -PreviousClose ), ( PreviousClose - Low )
The +DI , -DI and TR are each accumulated and smoothed using a custom smoothing method proposed by Wilder. For an n period smoothing, 1/n of each period’s value is added to the total each period, similar to an exponential smoothing:
+DIt = (+DIt-1 - (+DIt-1 / n)) + (+DIt)
-DIt = (-DIt-1 - (-DIt-1 / n)) + (-DIt)
TRt = (TRt-1 - (TRt-1 / n)) + ( TRt )
Compute the positive/negative Directional Indexes, +DI and -DI , as a percentage of the True Range:
+DI = ( +DI / TR ) * 100
-DI = ( -DI / TR ) * 100
Compute the Directional Difference as the absolute value of the differences: DIdiff = | (( +DI ) - ( -DI )) |
Sum the directional indicator values: DIsum = (( +DI ) + ( -DI )) .
Calculate the Directional Movement index: DX = ( DIdiff / DIsum ) * 100 . The DX is always between 0 and 100.
Finally, apply Wilder’s smoothing technique to produce the final ADX value:
ADXt = ( ( ADXt-1 * ( n - 1) ) + DXt ) / n
When indicator tell us to buy?
If when DI+ crosses DI- and ADX is bigger than DI- indicator tell us to buy.
Strategy Test - Cancel Limit Order and Position SizingWhile working thru another project had the need to troubleshoot the canceling of a limit order syntax/process as well as work thru the code and logic to automagically set the position sizing based off two user inputs (Amount to Risk in USD and Leverage to Use) and the potential entry and stop levels for an inside bar candle pattern in this scenario. Once we find the distance between the entry and stop level we can figure out the stop percentage amount which matches up with what a user would see manually drawing using the long or short tool in tradingview. Once we have the user inputs and levels we can get an amount to be used in later qty= type of places in zeeee pine script....

Stormer Setup [xdecow]This is the setup used by Alexandre Wolwacz (Stormer).
4 Exponential Moving Averages:
* 4 red
* 17 blue
* 34 black
* 80 green
Candle Colors:
* Red: possible top
* Blue: possible bottom
* Yellow: inside bar
Option to use Slow Stochastic as filter for top/bottom.

Flying Buddha Inside Bars Indicator v1 by JustUncleLDescription:
=============
This indicator plots MAs and paints Triggered Alert Arrows base on Flying Buddha candle patterns.
The “Flying Buddha” Pattern is defined as:
---------------------------------------------
A candlestick chart with two moving averages: the 5 period exponential moving average (fast EMA) and the 10 period simple moving average (slow SMA), both applied to the closing price. The default “Flying Buddha” pattern is any candlestick which:
1. Has a LOW above the fast EMA, when the fast EMA is above the slow SMA (a bearish “Flying Buddha”); or
2. Has a HIGH below the fast EMA, when the fast EMA is below the slow SMA (a bullish “Flying Buddha”).
Alert Trigger:
---------------
A Flying Buddha Alert is triggered on the first candle that is a non-flying Buddha candle after a Flying Buddha Pattern candle sequence. Flying Buddhas can optionally be filtered by InsideBars and PinBars.
The Alert Trigger is optionally filtered by the Directional MA (default=EMA 89), and/or by Minimum Sequence length of Flying Buddhas.
Moving Averages:
------------------
You can select between 11 different types of moving averages, for each MA line in Flying Buddha MAs (fastMA and slowMA) and the Directional Filter MA:
SMA = Simple Moving Average.
EMA = Exponential Moving Average.
WMA = Weighted Moving Average
VWMA = Volume Weighted Moving Average
SMMA = Smoothed Simple Moving Average.
DEMA = Double Exponential Moving Average
TEMA = Triple Exponential Moving Average.
HullMA = Hull Moving Average
SSMA = Ehlers Super Smoother Moving average
ZEMA = Near Zero Lag Exponential Moving Average.
TMA = Triangular (smoothed) Simple Moving Average.
NOTE: This is a concept indicator, I also intend to release a trading BOT suitable for Autoview, based on this concept indicator.

inside_bar (by cilivan)Simple script for coloring inside bars to spot them easier (color can be adjusted)
